Update - Friday, 4 May 2018 Trading Ideas And Analysis
There has been a lot of interest about our momentum statistics, what they mean, and how to use them. The normalized statistically-based momentum we calculate has a tendency to persist after a change in direction. We monitor and publish two time frames for momentum on the daily dashboard reports. The short-term statistic typically means 2-7 days and 2-7 weeks for long-term momentum. Knowing when momentum changes direction or is rapidly changing rank can give you a leading edge in the markets.
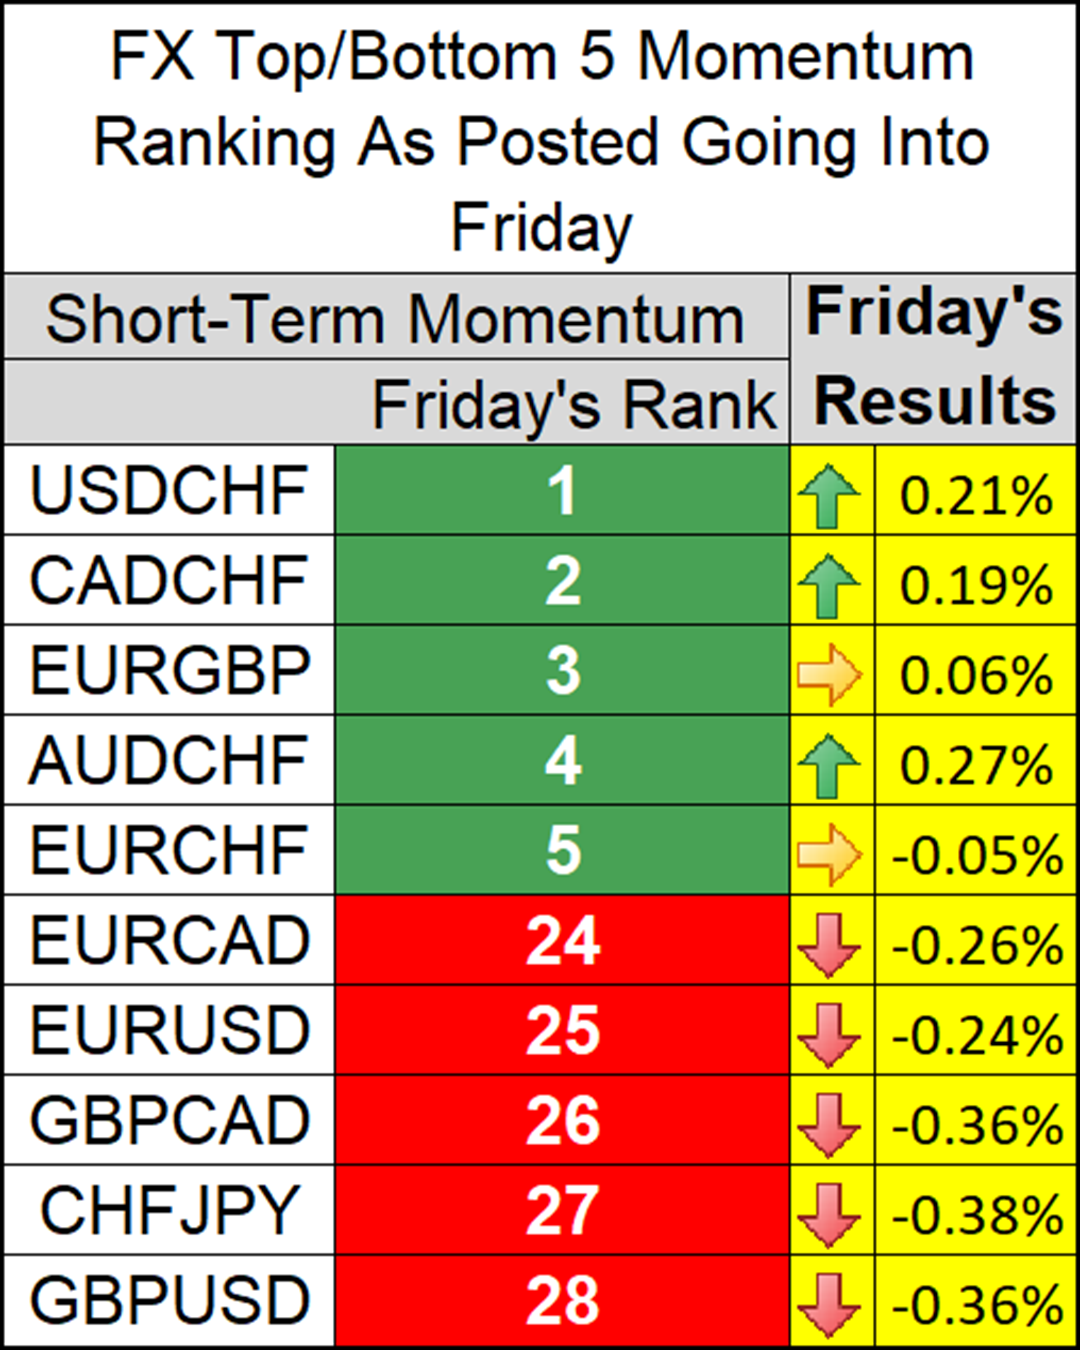
Going into Friday, we extracted and shared the top and bottom 5 currency pairs/crosses. The image with this post illustrates the results of such "persistence". Additionally, of the 28 primary currency pairs/crosses we monitor, all of the top and bottom ranked performers matched their respective short-term momentum direction on the dashboard report.
If you would like to see the full report or have any questions or comments please let us know at [email protected]
Have a great weekend!
Check out the limited-time Andersen Trading Solutions (ATS) dashboard trial
Get your fully-featured Forex and Commodities dashboard reports packed with institutional quality analytics and research for actionable trading ideas. Sign up now for your 14-day trial and see how you can significantly enhance your trading results.