Daily Forex Quantitative Trading Ideas And Analysis - 13 June 2018
Highlights from the Daily ATS Forex Dashboard report going into Wednesday, 13 June-
Volatility has largely swung from extreme highs to extreme lows (see image with this post for a visual representation)
Of note - $AUDJPY $EURJPY $GBPJPY and $USDCAD have experienced compressed ranges and are poised to breakout relatively soon.
Short-term momentum changes:
Positive - none
Negative - $EURUSD
Long-term momentum changes:
Positive - none
Negative - none
Structure changes:
Positive - $NZDJPY
Negative - none
The image with this post highlights the daily range as a percentage of the normalized typical range for the 8 major currencies we follow. Values shaded in blue exceed 1 standard deviation above typical range. Values shaded in orange exceed 1 standard deviation below typical range. Values highlighted in yellow exceed 2 standard deviations above or below typical range. Bold black values are highest or lowest of at least 20 days. Underlined values are lower than prior day....
Daily Forex Quantitative Trading Ideas And Analysis - 11 June 2018
Highlights from the Daily ATS Forex Dashboard report going into Monday, 11 June-
Short-term momentum changes:
Positive - none
Negative - $AUDNZD $CADJPY
Long-term momentum changes:
Positive - none
Negative - none
Structure changes:
Positive - $GBPAUD $EURAUD
Negative - $AUDJPY $AUDUSD $CADJPY $NZDJPY
Daily price range has compressed significantly for $EURUSD
3-day price range has compressed significantly for $GBPNZD and $NZDUSD
Compressed ranges are anticipated to expand relatively soon.
The image with this post is a 30-day correlation matrix. Several pairs have recently been highly correlated and inversely correlated. High correlations are highlighted in green. High inverse correlations are highlighted in red. Lack of correlation is highlighted in yellow.
Please feel free to reach out to [email protected] if you would like a copy of the full 24-page daily report to know more or if you have any questions. We would love to hear from y...
Daily Forex Quantitative Trading Ideas And Analysis - 4 June 2018
Highlights from the Daily ATS Forex Dashboard report going into Monday, 4 June-
Short-term momentum changes:
Positive - $CHFJPY, $GBPCAD, $NZDJPY, $USDJPY,
Negative - JPY
Long-term momentum changes:
Positive - none
Negative - none
Structure changes:
Positive - $AUDJPY, $CHFJPY, $EURCHF, $EURJPY, $NZDCHF, $NZDJPY
Negative - none
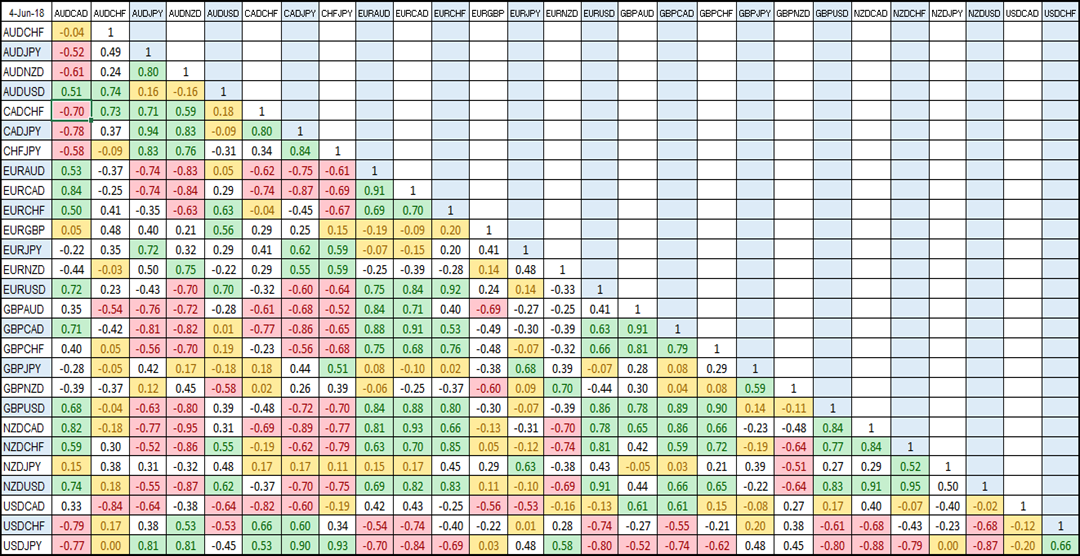
The image with this post is a 30-day correlation matrix. Several pairs have recently been highly correlated and inversely correlated e.g. $USDJPY as seen in the image.
Please feel free to reach out to [email protected] if you would like a copy of the full 24-page daily report to know more or if you have any questions. We would love to hear from you.
Make it a great day!
Daily Forex Quantitative Trading Ideas And Analysis - 1 June 2018
Highlights from the Daily ATS Forex Dashboard report going into Friday, 1 June-
Short-term momentum changes:
Positive - $AUDUSD, $NZDUSD
Negative - none
Long-term momentum changes:
Positive - none
Negative - $EURNZD, $GBPNZD
Structure changes:
Positive - $AUDUSD, $EURUSD, $GBPUSD, $NZDCHF, $NZDUSD
Negative - none
The image with this post ranks short-term momentum for the majors. The strongest momentum is ranked "1" in dark green and "8" is the weakest or most negative. This gives you a visual representation of strength and weakness to construct trades with corresponding pairs and crosses that represent buying strength and selling weakness. The most opportunistic trades tend to be when there is a shift in trend moving toward the top or bottom of the momentum ranks.
Please feel free to reach out to [email protected] if you would like a copy of the full 24-page daily report to know more or if you have any questions. We would love to hear from you.
Make it...
Daily Forex Quantitative Trading Ideas And Analysis - 31 May 2018
Highlights from the Daily ATS Forex Dashboard report going into Thursday, 31 May-
Volatility continues to impress after months of continued decline in the FX markets.
Last week we mentioned JPY was notably gaining strength the short-term momentum rank shifted. Today we note that USD has shifted significantly from strength to weakness (See image).
Short-term momentum changes:
Positive - $EURGBP
Negative - $USDCHF
Long-term momentum changes:
Positive - none
Negative - none
The image with this post ranks short-term momentum for the majors. The strongest momentum is ranked "1" in dark green and "8" is the weakest or most negative. This gives you a visual representation of strength and weakness to construct trades with corresponding pairs and crosses that represent buying strength and selling weakness. The most opportunistic trades tend to be when there is a shift in trend moving toward the top or bottom of the momentum ranks (see USD).
Please feel free to reach out to WeCa...
Daily Forex Quantitative Trading Ideas And Analysis - 30 May 2018
Highlights from the Daily ATS Forex Dashboard report going into Wednesday, 30 May-
Volatility continues to surge in the FX markets.
Last week we mentioned JPY was notably gaining strength the short-term momentum rank shifted (See image).
Short-term momentum changes:
Positive - none
Negative - $AUDCHF, $AUDUSD
Long-term momentum changes:
Positive - none
Negative - $EURCHF, $GBPCHF
Price structure has turned negative for $AUDNZD, $AUDUSD, and $EURGBP.
The image with this post ranks short-term momentum for the majors. The strongest momentum is ranked "1" in dark green and "8" is the weakest or most negative. This gives you a visual representation of strength and weakness to construct trades with corresponding pairs and crosses that represent buying strength and selling weakness. The most opportunistic trades tend to be when there is a shift in trend moving toward the top or bottom of the momentum ranks (see JPY).
Please feel free to reach out to WeCare@AndersenTradingS...
Daily Forex Quantitative Trading Ideas And Analysis - 29 May 2018
Highlights from the Daily ATS Forex Dashboard report going into Tuesday, 29 May-
Volatility and directional movement are likely to increase for $AUDUSD and $EURGBP
Short-term momentum changes:
Positive - $NZDCAD
Negative - none
Long-term momentum changes:
Positive - none
Negative - none
Price structure has turned negative for $CADCHF and positive for $EURCAD, $NZDCAD, and $USDCAD
The image with this post ranks short-term momentum for the majors. The strongest momentum is ranked "1" in dark green and "8" is the weakest or most negative. This gives you a visual representation of strength and weakness to construct trades with corresponding pairs and crosses that represent buying strength and selling weakness. The most opportunistic trades tend to be when there is a shift in trend moving toward the top or bottom of the momentum ranks.
Please feel free to reach out to [email protected] if you would like a copy of the full 24-page daily report to know ...
Daily Forex Quantitative Trading Ideas And Analysis - 25 May 2018
Highlights from the Daily ATS Forex Dashboard report going into Friday, 25 May-
Volatility has generally remained elevated and is not likely to persist.
However, price ranges have compressed significantly for $EURUSd and $NZDUSD and are anticipated to increase relatively soon.
Short-term momentum changes:
Positive - $AUDCAD
Negative - $CADCHF, $CADJPY, $CHFJPY, $USDJPY
Long-term momentum changes:
Positive - none
Negative - none
The structure has turned negative for $CADJPY, $CHFJPY, $EURJPY $NZDJPY
The image with this post ranks short-term momentum for the majors. The strongest momentum is ranked "1" in dark green and "8" is the weakest or most negative. This gives you a visual representation of strength and weakness to construct trades with corresponding pairs and crosses that represent buying strength and selling weakness. The most opportunistic trades tend to be when there is a shift in trend moving toward the top or bottom of the momentum ranks (See JPY).
Please...
Daily Forex Quantitative Trading Ideas And Analysis - 24 May 2018
Highlights from the Daily ATS Forex Dashboard report going into Thursday, 24 May-
Volatility has increased substantially. All 8 of the major currencies exceeded 100% of the normalized typical range (see image).
Short-term momentum changes:
Positive - $USDCAD
Negative - $USDCAD
Long-term momentum changes:
Positive - none
Negative - $NZDCHF
The structure has turned negative for $AUDCHF $AUDJPY $USDJPY
The image with this post highlights the daily range as a percentage of the normalized typical range for the 8 major currencies. Values shaded in blue exceed 1 standard deviation above typical range. Values shaded in orange exceed 1 standard deviation below typical range. Values highlighted in yellow exceed 2 standard deviations above or below typical range. Bold black values are highest or lowest of at least 20 days. Underlined values are lower than prior day.
Please feel free to reach out to [email protected] if you would like a copy of the full 24-page ...
Daily Forex Quantitative Trading Ideas And Analysis - 23 May 2018
Highlights from the Daily ATS Forex Dashboard report going into Wednesday, 23 May-
Daily analysis suggests an increase in volatility is anticipated soon for $AUDUSD, $AUDNZD, $GBPAUD, $EURGBP.
Short-term momentum changes: none
Long-term momentum changes:
Positive - none
Negative - $GBPAUD
The structure has turned positive for $EURGBP
The image with this post ranks short-term momentum for the majors. The strongest momentum is ranked "1" in dark green and "8" is the weakest or most negative. This gives you a visual representation of strength and weakness to construct trades with corresponding pairs and crosses that represent buying strength and selling weakness. The most opportunistic trades tend to be when there is a shift in trend moving toward the top or bottom of the momentum ranks.
Please feel free to reach out to [email protected] if you would like a copy of the full 24-page daily report to know more or if you have any questions. We would love to ...