Daily Forex Quantitative Trading Ideas And Analysis - 25 May 2018
Highlights from the Daily ATS Forex Dashboard report going into Friday, 25 May-
Volatility has generally remained elevated and is not likely to persist.
However, price ranges have compressed significantly for $EURUSd and $NZDUSD and are anticipated to increase relatively soon.
Short-term momentum changes:
Positive - $AUDCAD
Negative - $CADCHF, $CADJPY, $CHFJPY, $USDJPY
Long-term momentum changes:
Positive - none
Negative - none
The structure has turned negative for $CADJPY, $CHFJPY, $EURJPY $NZDJPY
The image with this post ranks short-term momentum for the majors. The strongest momentum is ranked "1" in dark green and "8" is the weakest or most negative. This gives you a visual representation of strength and weakness to construct trades with corresponding pairs and crosses that represent buying strength and selling weakness. The most opportunistic trades tend to be when there is a shift in trend moving toward the top or bottom of the momentum ranks (See JPY).
Please...
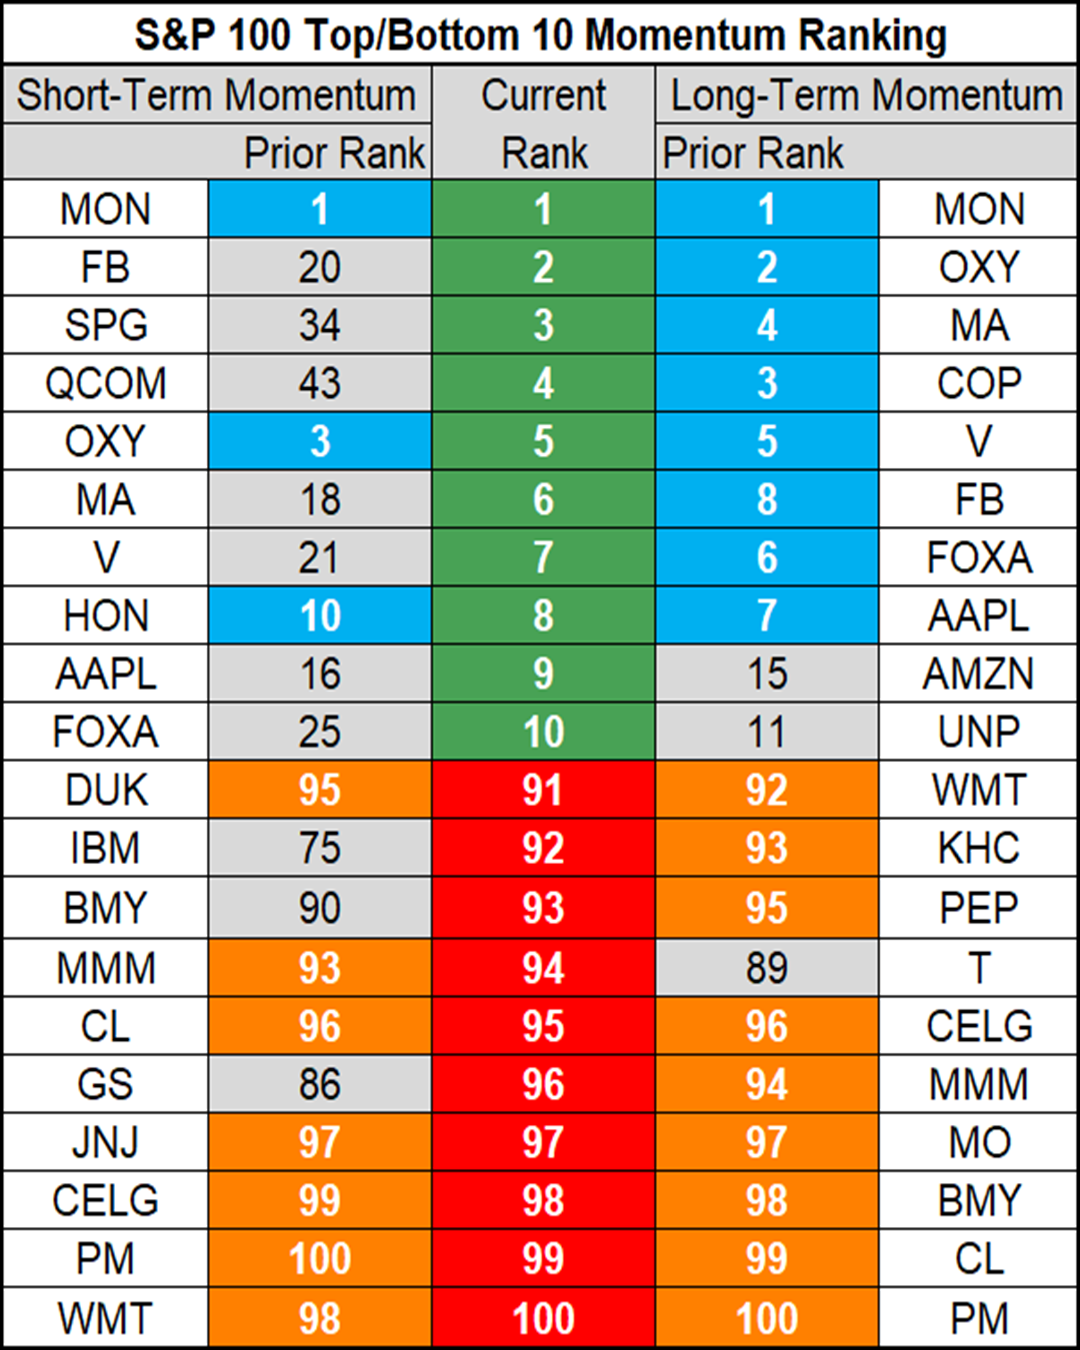
Daily 10 Momentum Stocks - 24 May 2018
Top 5 short-term momentum stocks of the S&P 100: $MON $FB $SPG $QCOM $OXY
Bottom 5 short-term momentum stocks of the S&P 100: $GS $JNJ $CELG $PM $WMT
Top 5 long-term momentum stocks of the S&P 100: $MON $OXY $MA $COP $V
Bottom 5 long-term-term momentum stocks of the S&P 100: $MMM $MO $BMY $CL $PM
Daily Forex Quantitative Trading Ideas And Analysis - 24 May 2018
Highlights from the Daily ATS Forex Dashboard report going into Thursday, 24 May-
Volatility has increased substantially. All 8 of the major currencies exceeded 100% of the normalized typical range (see image).
Short-term momentum changes:
Positive - $USDCAD
Negative - $USDCAD
Long-term momentum changes:
Positive - none
Negative - $NZDCHF
The structure has turned negative for $AUDCHF $AUDJPY $USDJPY
The image with this post highlights the daily range as a percentage of the normalized typical range for the 8 major currencies. Values shaded in blue exceed 1 standard deviation above typical range. Values shaded in orange exceed 1 standard deviation below typical range. Values highlighted in yellow exceed 2 standard deviations above or below typical range. Bold black values are highest or lowest of at least 20 days. Underlined values are lower than prior day.
Please feel free to reach out to [email protected] if you would like a copy of the full 24-page ...
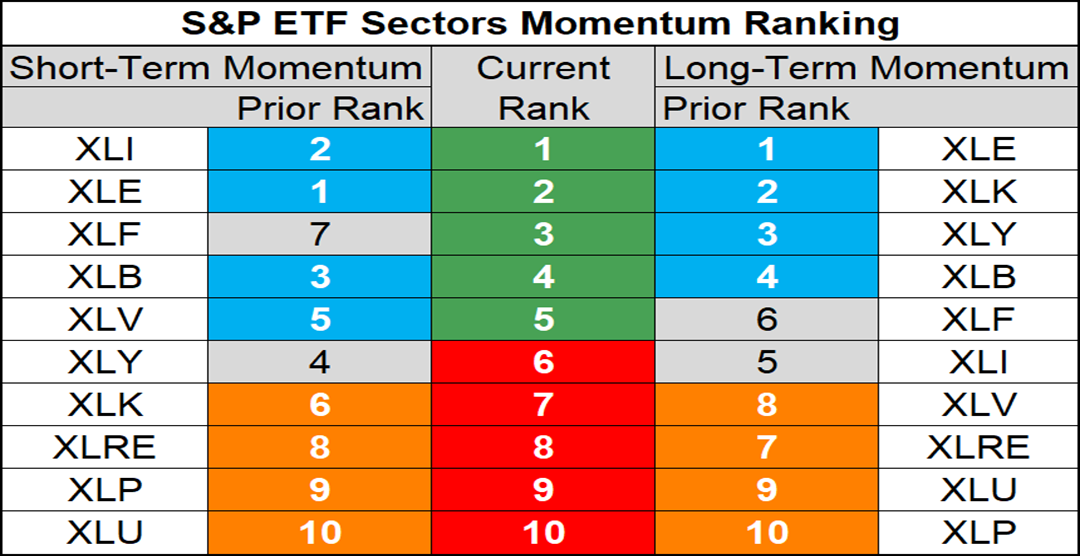
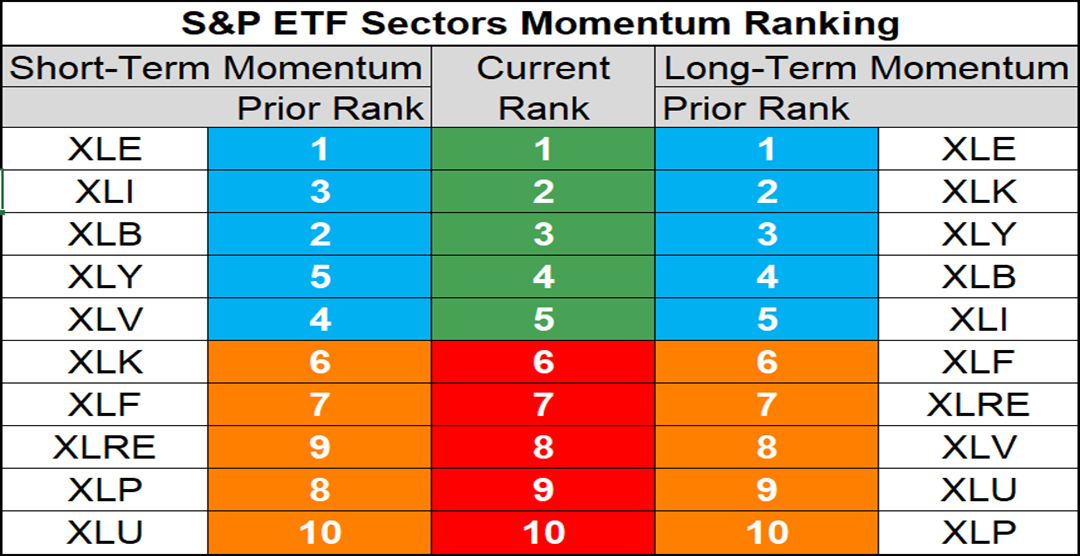
S&P 500 Sector ETF Momentum Rankings - 23 May 2018
S&P 500 Sector ETF Short-Term Momentum Rankings:
$XLI $XLE $XLF $XLB $XLV $XLY $XLK $XLRE $XLP $XLU
Long-Term Momentum Rankings:
$XLE $XLK $XLY $XLB $XLF $XLI $XLV $XLRE $XLU $XLP
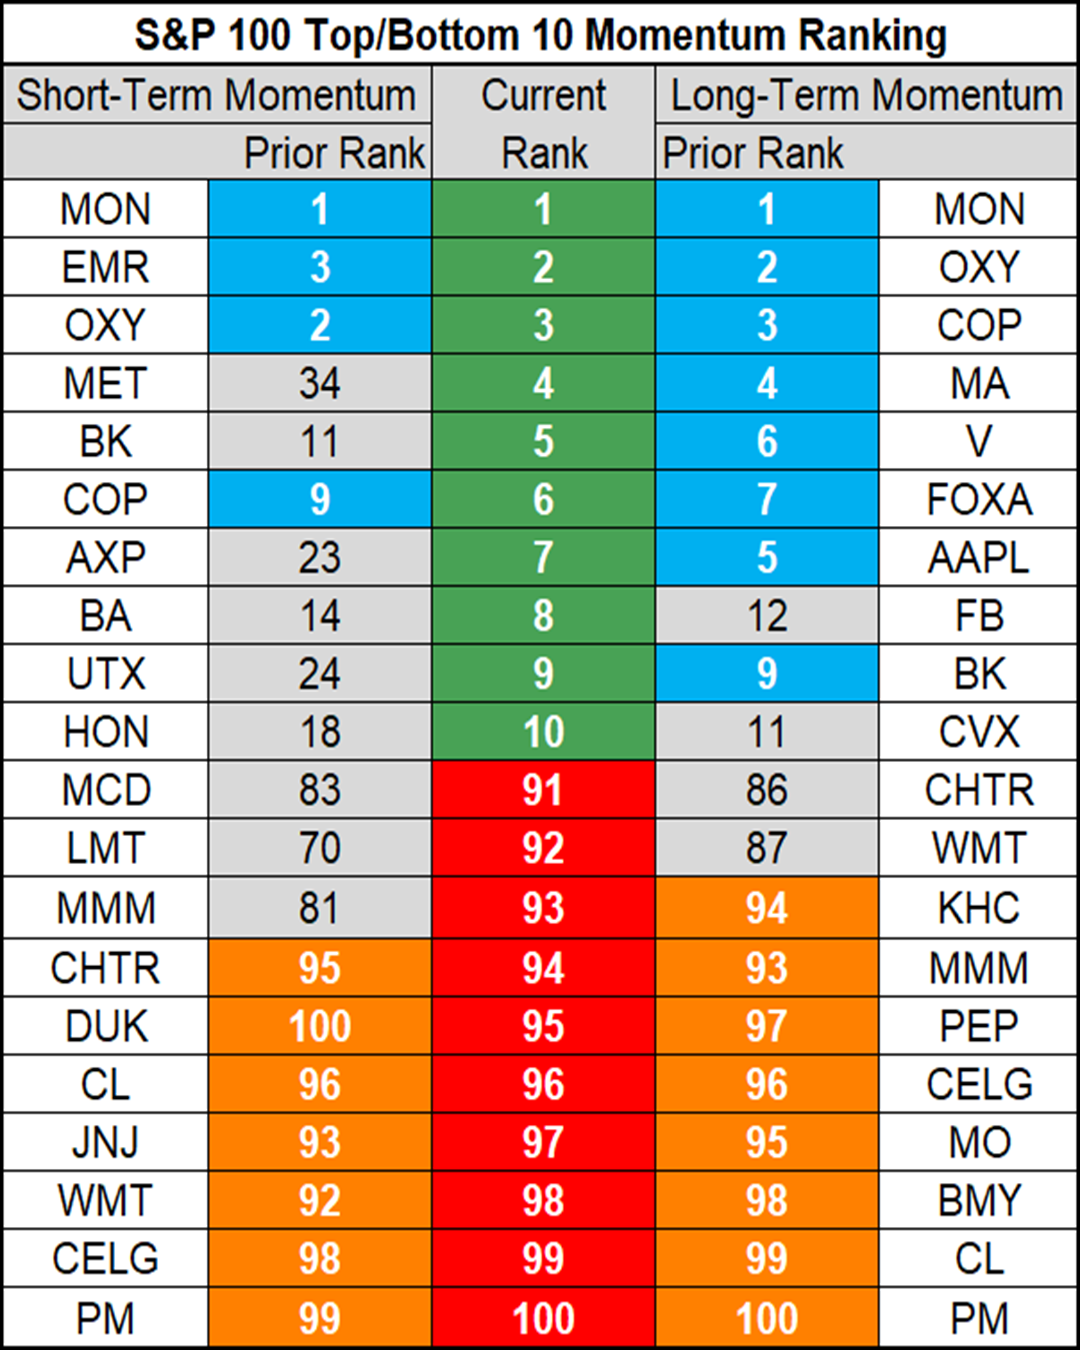
Daily 10 Momentum Stocks - 23 May 2018
Top 5 short-term momentum stocks of the S&P 100: $MON $EMR $OXY $MET $BK
Bottom 5 short-term momentum stocks of the S&P 100: $CL $JNJ $WMT $CELG $PM
Top 5 long-term momentum stocks of the S&P 100: $MON $OXY $COP $MA $V
Bottom 5 long-term-term momentum stocks of the S&P 100: $CELG $MO $BMY $CL $PM
Daily Forex Quantitative Trading Ideas And Analysis - 23 May 2018
Highlights from the Daily ATS Forex Dashboard report going into Wednesday, 23 May-
Daily analysis suggests an increase in volatility is anticipated soon for $AUDUSD, $AUDNZD, $GBPAUD, $EURGBP.
Short-term momentum changes: none
Long-term momentum changes:
Positive - none
Negative - $GBPAUD
The structure has turned positive for $EURGBP
The image with this post ranks short-term momentum for the majors. The strongest momentum is ranked "1" in dark green and "8" is the weakest or most negative. This gives you a visual representation of strength and weakness to construct trades with corresponding pairs and crosses that represent buying strength and selling weakness. The most opportunistic trades tend to be when there is a shift in trend moving toward the top or bottom of the momentum ranks.
Please feel free to reach out to [email protected] if you would like a copy of the full 24-page daily report to know more or if you have any questions. We would love to ...
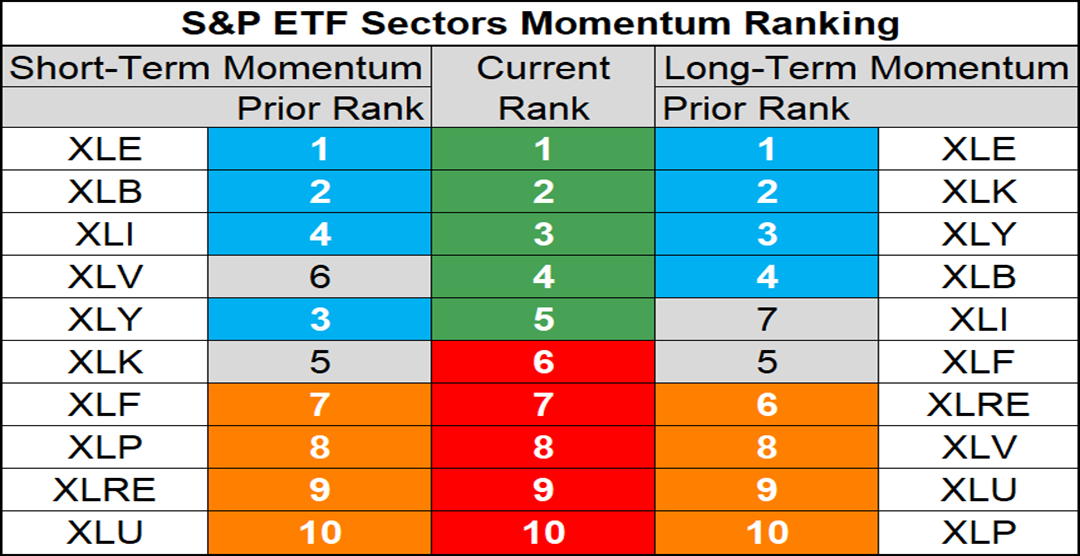
S&P 500 Sector ETF Momentum Rankings - 22 May 2018
S&P 500 Sector ETF Short-Term Momentum Rankings:
$XLE $XLI $XLB $XLY $XLV $XLK $XLF $XRE $XLP $XLU
Long-Term Momentum Rankings:
$XLE $XLK $XLY $XLB $XLI $XLF $XLRE $XLV $XLU $XLP
Daily Forex Quantitative Trading Ideas And Analysis - 22 May 2018
Highlights from the Daily ATS Forex Dashboard report going into Tuesday, 22 May-
Daily analysis suggests an increase in volatility is anticipated soon for $USDCHF.
Short-term momentum changes:
Positive - $AUDUSD, $NZDJPY
Negative - $USDCAD, $EURAUD
Long-term momentum changes:
Positive - none
Negative - $EURAUD
The structure has turned negative for $GBPNZD
The image with this post ranks short-term momentum for the majors. The strongest momentum is ranked "1" in dark green and "8" is the weakest or most negative. This gives you a visual representation of strength and weakness to construct trades with corresponding pairs and crosses that represent buying strength and selling weakness. The most opportunistic trades tend to be when there is a shift in trend moving toward the top or bottom of the momentum ranks.
Please feel free to reach out to [email protected] if you would like a copy of the full 24-page daily report to know more or if you have any q...
S&P 500 Sector ETF Momentum Rankings - 21 May 2018
S&P 500 Sector ETF Short-Term Momentum Rankings:
$XLE $XLB $XLI $XLV $XLY $XLK $XLF $XLP $XLRE $XLU
Long-Term Momentum Rankings:
$XLE $XLK $XLY $XLB $XLI $XLF $XLRE $XLV $XLU $XLP
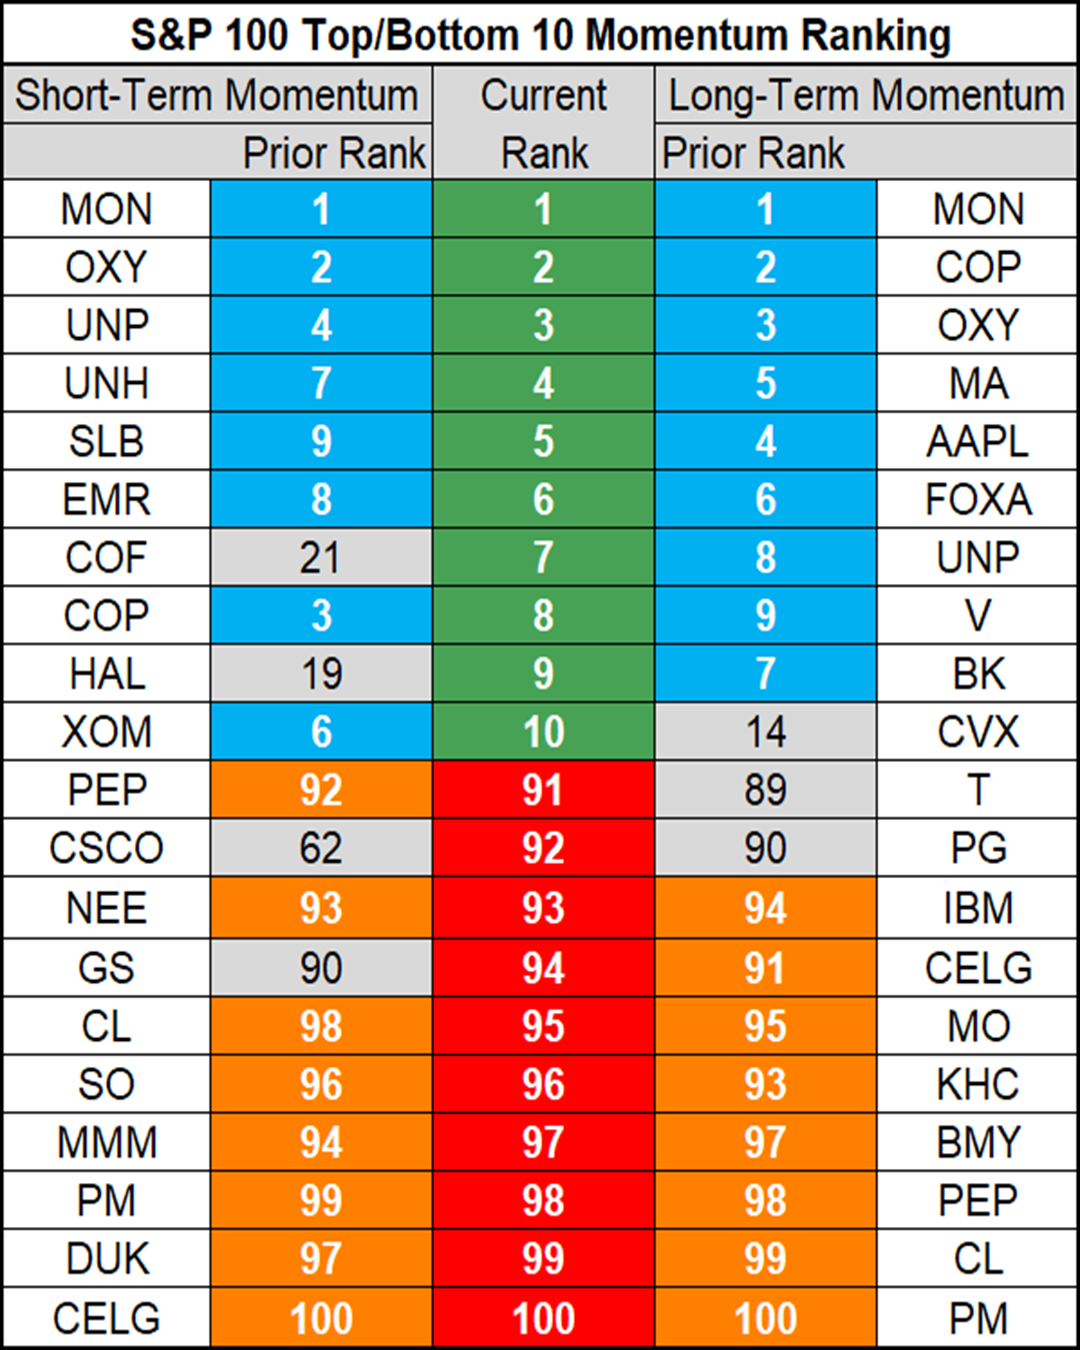
Daily 10 Momentum Stocks - 21 May 2018
Top 5 short-term momentum stocks of the S&P 100: $MON $OXY $UNP $UNH $SLB
Bottom 5 short-term momentum stocks of the S&P 100: $SO $MMM $PM $DUK $CELG
Top 5 long-term momentum stocks of the S&P 100: $MON $COP $OXY $MA $AAPL
Bottom 5 long-term-term momentum stocks of the S&P 100: $KHC $BMY $PEP $CL $PM